
My wife and I were finally able to purchase a house in Fort Collins, Colorado. We are going to be working on remodeling projects for the next couple of months while we get ready to move in and get our house ready to rent out. With all that going on, I probably won’t have time for much of my normal projects, so I am just going to blog about progress on the houses. Hopefully the theoretical readership of the blog will help motivate me to stop playing Zelda and build things IRL.
It’s easy to get paralyzed with indecision when working on a project, especially right at the beginning when there are lots decisions that need to be made all at once. The Fort Collins housing market is nuts. When we were looking for a house, the market would turn over once a week or so, so we needed to first decide which houses might be worth seeing. To help with that, I used a tool that I used a lot as an engineer: the decision matrix.
A decision matrix is any kind of organizational tool that quantifies options by utility. If you make a pro and con list before making a decision, that is essentially a simple decision matrix. Engineers use decision matrices to organize their design decisions and to show their work when a customer asks why a certain decision was made over multiple iterations of a design process. There are more complicated types of decision matrix, like the “house of quality,” but all I need for this purpose is a simple comparison. I would highly recommend using a spreadsheet tool like LibreOffice Calc or Google Sheets for this (I guess you could use Excel if you want).
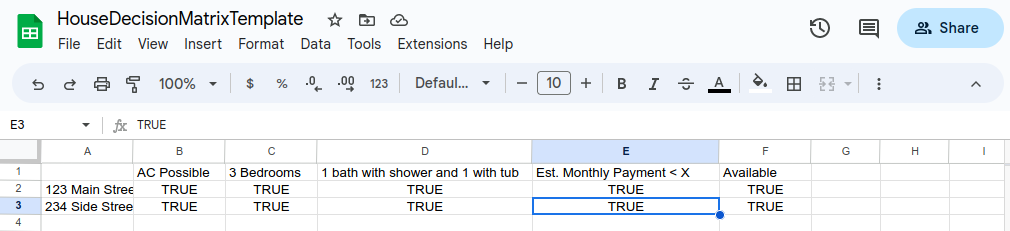
First, I start with creating requirements. These are no-go conditions. If a house (design) doesn’t meet these conditions, I don’t even want to think about it. These are usually pretty low bars. For example, my requirements for a house were that it could potentially have air conditioning, have at least 3 bedrooms, have at least 1.5 bathrooms, that the estimated monthly payments wouldn’t overrun our budget, and that it was actually on the market. I put these in the columns of one sheet of my workbook.
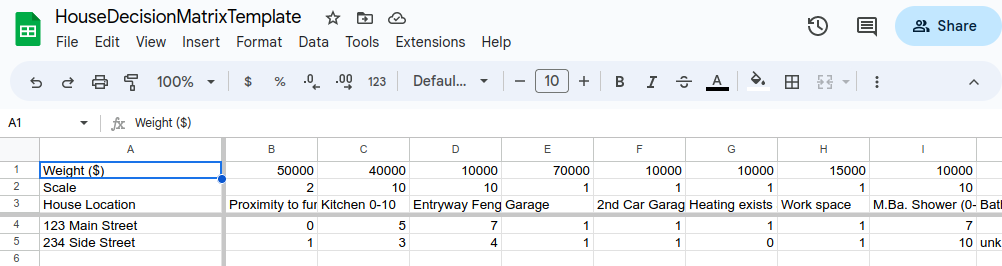
Second, I create a list of specifications. These need to be quantified, but they can be totally subjective. I put them in the columns of a different sheet, leaving 2 rows above for a scale and a weight. The scale is the divisor of the value, so if I have a column like “solar panels” the scale will be 1, as in 0=no solar panels and 1=has solar panels. If I have a column like “transit score from USDOT,” the scale will be 100, as in 20/100 (transit desert).
Now for the tricky part, going through and setting a value for everything. Each specification should be weighted by the money that it is worth to you. For example, if the house needs immediate improvements before I can even consider moving stuff in, I think the house is worth $2 less to me for every $1 of required repairs, so I will use a scale of 1, a weight of -2, and I will put in values of, say, $5000 for replacing flooring. Most of our specifications were things like “quality of master bathroom shower” with a scale of 10 and a weight of $10,000, with the intention that we would subjectively rate the shower compared to our current shower and scale it by about how much that project cost. I recommend using a spreadsheet program instead of writing decision matrices out, because you will want to go back and fiddle with the knobs as you learn more about what you are looking for.
There is another sheet with formulas for calculating the specification scores and checking to see if the specifications are all filled out, and then a summary sheet shows the final score, which is the sum of all the specification scores minus the list price of the house (imagine the list price of the house is another column in the specifications sheet with weight/scale of -1/1). This is a score, not a measurement, and it only has meaning relative to the other items in the matrix. What it means is “given that these houses are the same in all aspects not captured here, this is how much net utility in dollars we would get for the purchase.” The values should all be negative, because none of the “aspects not captured here” are not quantified. In a true engineering decision matrix, we would try to quantify everything somehow and we might use the net utility to decide whether or not to make the purchase at all, but we can afford be a lot more subjective when buying a house than when launching rockets.
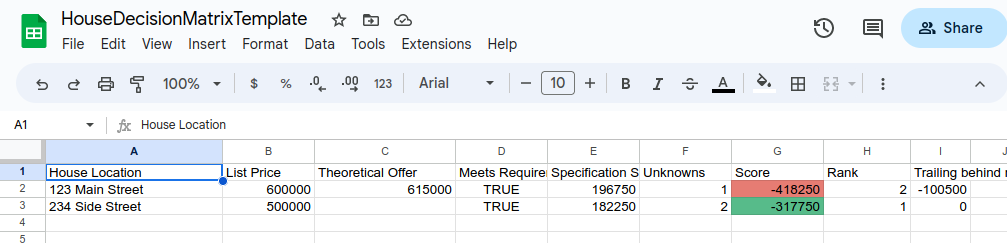
The important thing is that, once you have that summary with the scores, you can rank the options. In a given week, we only had time to see a maximum of 3 houses before they would sell because we have jobs and other stuff going on. We used this tool to rank our top 3 options for the week so we could just focus on those. Each week, we still picked our favorite of the top contenders to try to put an offer on just based on our impressions after seeing them. It really helped us to find an option that could be the best overall without standing out as the best in any individual category, which I think is a good description of the house that we ended up buying. I am very excited to work on it, and I will be posting progress as we go.
If you would like to use my house decision matrix as a template, you can download it here. It can be used to compare a limited number of rows and columns, but the formulas ranges could easily be expanded if necessary.